Bankroll Variance
How long a losing run is normal at your odds — and the bankroll needed to survive it.
Open Bankroll Variance →Overview
Bankroll Variance answers the question every staking plan should ask first: how long a losing run is normal, and how much capital you need to ride it out. It works for any system and any selections — you just give it your odds and how many bets you plan to place.
Unlike the staking tools, this one isn’t about how much to bet — it’s about whether your bankroll is big enough to survive the swings that come with betting at all.
What it is
Even a winning method goes through losing runs — that’s variance, and it’s unavoidable. This tool calculates, from exact probability, the distribution of your longest losing streak over a series of bets: the typical length, and the unlucky-but-normal cases.
The single most useful output is the 95% worst-case streak — the run length only about 1 series in 20 will exceed. Multiply it by your stake and you have the bankroll that survives normal variance.
How to use it
- 1Enter your typical decimal odds (or turn on a custom strike rate to use the win rate you actually expect).
- 2Choose how many bets you plan to place — the quick chips cover 100 to 10,000.
- 3Optionally enter your flat stake per bet to unlock the bankroll table.
- 4Read the headline streak figures, then the bankroll needed at each confidence level.
- 5Lower your stake (or raise your bankroll) until the 95% line is comfortable.
Worked example
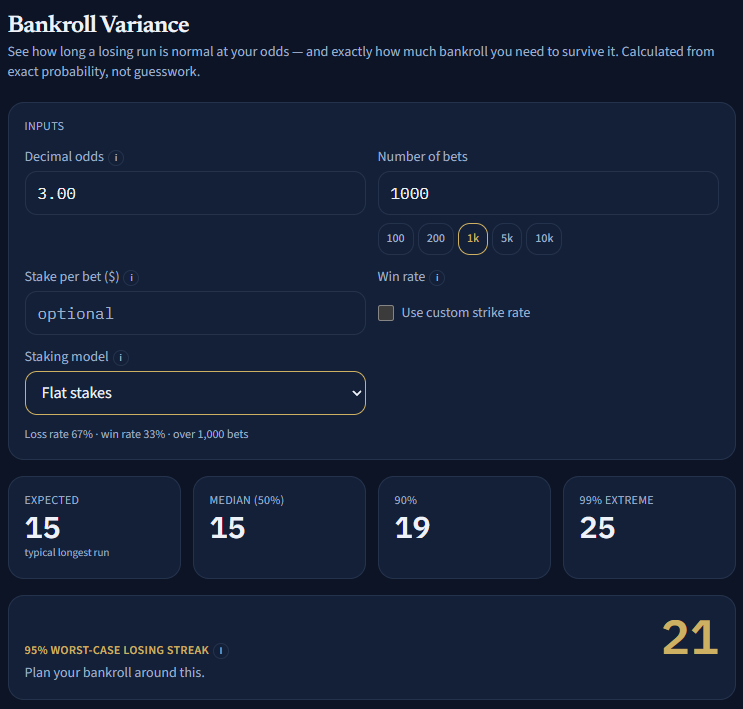
Typical longest losing run: about 15
95% worst-case: 21    ·    99% extreme: 25
A run of 10+ losses: ~99.8% likely (expect ~5–6 of them)
A run of 20+ losses: ~9% likely
At $100 a bet, surviving the 95% streak (21) needs a $2,100 bankroll
These are exact figures for these inputs — not a simulation estimate, and not a prediction of any single run.
Reading the outputs
- Expected / median — the longest run you’d typically see; half the time it’s shorter, half longer.
- 90% / 95% / 99% — the run length you stay within that often. 95% is the standard planning figure.
- Chance & frequency table — how likely a run of 5/10/15/20/25/30 is, and how many to expect.
- Bankroll table — stake × the streak at each confidence level = the capital that survives it.
- Charts — the spread of your longest run, the chance of each length or worse, and how runs grow with more bets.
Bankroll stress test
Set a flat stake and the tool fills a table of the bankroll needed to survive each confidence level. The 95% row is the realistic planning figure used by professionals; the 99% row is a sterner buffer. Neither is a worst-imaginable case — streaks can still exceed them, so leave headroom.
Flat vs The Mint staking
By default the bankroll figure assumes flat stakes — the same bet every time — so it is simply your stake times the streak. Switch the staking model to The Mint to see recovery staking instead: because the stake grows through a losing run, the same streak demands far more capital. The tool plays out the worst-case run bet by bet (using the real Mint recovery engine, including its brake) and shows the cumulative outlay next to the flat figure for comparison.
The simulation is uncapped — it assumes you keep recovering — so in practice your max-bet cap or your bankroll would force you to rule off earlier. That is exactly the lesson: recovery staking turns a long-but-normal losing run into a steep bankroll demand, which is why a cap and a rule-off discipline matter.
In The Mint mode you also get the chance of busting and the chance of ending in profit over your run, for a starting bank you choose. These are estimated by simulation — recovery plans often profit in most runs but carry a real bust tail, and that tail is the risk to size your bank against.
Choosing your inputs
- Use the odds you actually bet at — shorter prices win more often (shorter runs), longer prices win less often (much longer runs).
- If you have a real edge, turn on the custom strike rate and enter your true win rate rather than the odds-implied one.
- Pick a bet count that matches how much you’ll actually bet — longer horizons make long streaks more likely, so plan for them.
- Size your bankroll to the 95% line at minimum; if busting would be a disaster, plan to the 99% line.
Tips & common mistakes
- Don’t plan to the average — the average run will be exceeded roughly half the time.
- A low chance is never zero: rare long streaks still happen, especially over thousands of bets.
- Variance is about survival, not profit — a big enough bankroll keeps you in the game long enough for an edge to show.
FAQ
- Does this predict my next losing run?
- No. It’s a probability model of what’s normal — it sizes a bankroll, it doesn’t forecast any particular sequence.
- Why are long losing streaks so likely?
- Over hundreds or thousands of bets, even a good method will hit a long cold run — that’s simply how independent chance behaves.
- Odds or custom strike rate?
- Odds give the no-edge baseline. If you genuinely win more often than the price implies, enter your real strike rate.
Responsible play
A staking plan changes how much you stake, not whether a bet wins, and nothing removes the house edge. These tools are educational calculators — they do not place bets, take money, or give tips.
Set a daily loss limit and, if you need a break, a cool-off in Settings. Never stake money you cannot afford to lose. Free, confidential support: National Gambling Helpline 1800 858 858 (24/7).
What's free, what's not
Bankroll Variance is free — every output, no cap. Sign in only to keep your settings synced across devices.
One email a month on staking systems and bankroll maths — no tips, ever.
OutlayHQ is educational staking & bankroll-management calculator software. It does not place bets, take money, or provide betting tips. Gambling involves risk — never bet more than you can afford to lose. For free, confidential support call the Australian National Gambling Helpline on 1800 858 858.